
As is common in August, the rise in late summer temperatures often leads to a cooling in sales. I mean who wants to look at houses when temperatures are near triple digits? With this slower sales activity, August inventory slightly increased and home prices stabilized. Coupled with mortgage rates approaching lows not seen since February 2023, the fall Houston real estate market looks like an attractive season for homebuyers.
Key Highlights from the Houston Association of Realtors (HAR) August 2024 Market Update:
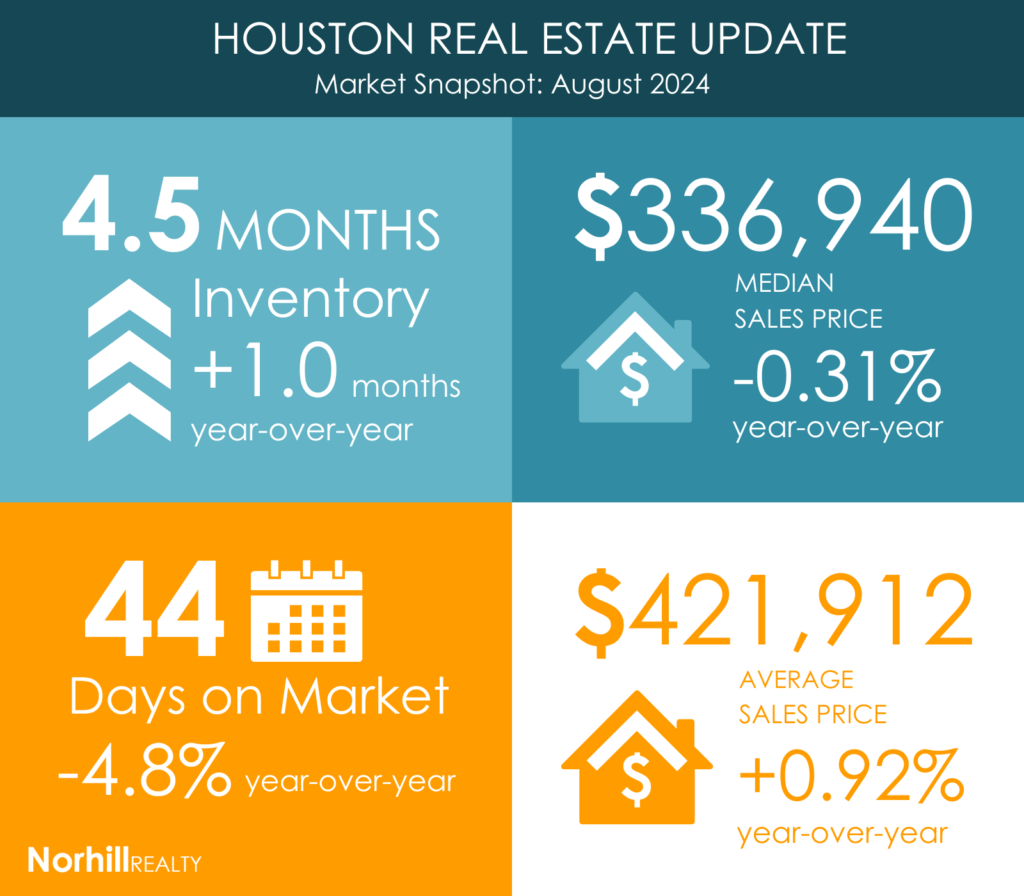
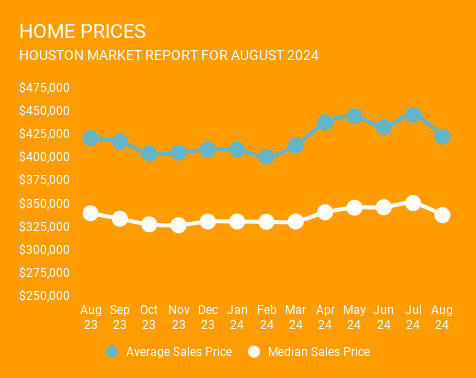
Home Prices: The average price of a single-family home modestly increased by 0.9% to $421,912 from 2023, while the median price slightly decreased by 0.3% to $336,940.
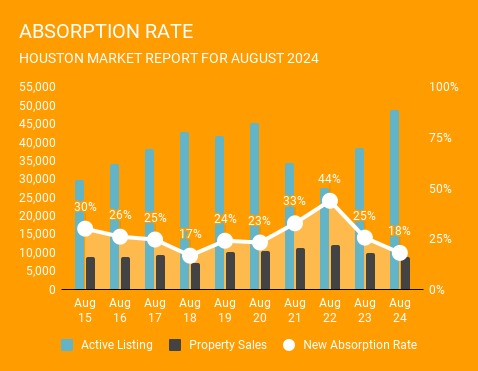
Likely to Sale: According to HAR, total active listings, or the total number of available properties, increased 29.3 percent to 48,774. August sales of all property types totaled 8,730 down 11.2 percent compared to August 2023.
As a result, the absorption rate, which is a measure of any given home’s likelihood to sell, for August 2024 was 18 percent. This is slightly under the 19% absorption rate we saw in July.
Market Segments: The luxury market, representing 4.1% of total sales, was the standout with a 2.0% increase in sales. The most significant sales drop occurred in homes priced between $100,000 and $149,000, with a 13.2% decrease.
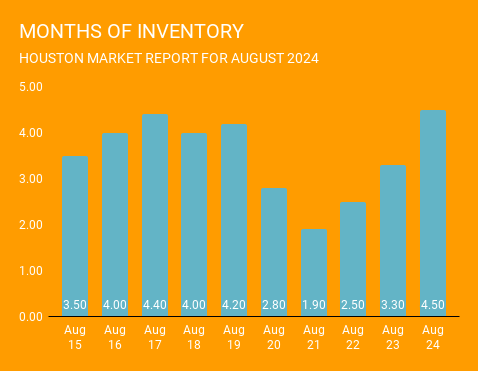
Inventory: The months supply of homes expanded to 4.5, the most since September 2012. Housing inventory nationally stands at a 4.0-months supply, according to the latest report from the National Association of Realtors (NAR). A 4.0- to 6.0-months supply is generally considered a “balanced market” in which neither buyer nor seller has an advantage.
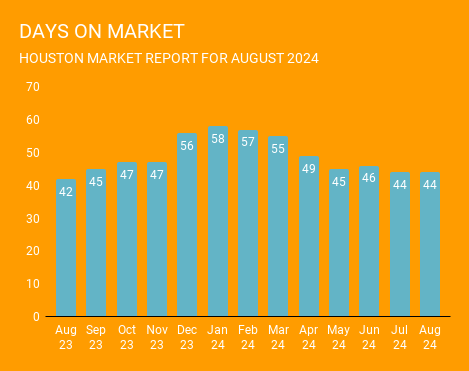
Days on Market:
Days on market has remained pretty stable over the past 4 months and are only slightly higher than August 2023.
Single-Family Homes Update:
Despite some slowing, single-family home sales showed resilience with prices only gently rising. The average price per square foot saw a minor decline, suggesting a slight easing in pricing pressures. Active listings reached a peak not seen since July 2011, and homes took slightly longer to sell.
Townhouse/Condominium Trends:
The townhouse and condominium segment also experienced declines, with a 16.7% drop in sales and a slight decrease in average prices. However, the median price remained stable, and inventory levels rose dramatically, echoing the trends seen across the broader market.
Looking Ahead:
As the market adjusts to the high inventory and moderated prices, potential buyers may find increasing opportunities to purchase homes under less competitive conditions. However, recent declines in mortgage rates could heat the market back up as mortgage rates near sub-6%.
For a comprehensive overview and expert advice, consider connecting with Norhill Realty to navigate these trends effectively. Fill out the form to get started.
GET MATCHED WITH AN AGENT