The market in the Rice Military has slowed a little bit in the month of January. Prices from month to month are down slightly and homes are taking a little longer to sell than they were taking in the fall. That’s not unexpected this time of year. Things tend to slow down in the winter months. Despite this mild slow down, prices rose year over year by 14%. Time will only tell whether this slow down is a seasonal trend or a longer-term trend. See below some additional details regarding the state of the market.
Homes Sold
There were 54 total sales in the month of January in Rice Military. That’s down 7% from January 2013, when there were 58 total sales. Despite that small drop-off, home sales have continued to sell fairly quickly. Half of all homes that sold in January were under contract in 24 days or less. In comparison, half of all homes sold in 33 days or less.
| MLS# | Address | Building SF | List Price | Beds | Full Bath | Half Bath | Garage # | Lot Size | Year Built |
| 4186580 | 5322 CALLE CADIZ | 3035 | 855,000 | 3 | 3 | 1 | 2 | 1828 | |
| 73304716 | 5432 Petty | 2101 | 399,990 | 3 | 2 | 1 | 2 | 2013 | |
| 19697113 | 1420 HOLLY | 2207 | 335,000 | 3 | 3 | 1 | 2 | 2000 | 2013 |
| 66868158 | 1416 HOLLY | 2174 | 325,000 | 3 | 2 | 1 | 2 | 1500 | 2012 |
| 70212094 | 1620 Ovid Street | 2000 | 388,000 | 3 | 3 | 1 | 2 | 2013 | |
| 65769847 | 2110 Colorado Street | 2087 | 389,000 | 3 | 3 | 1 | 2 | 2013 | |
| 1936391 | 4408 A Eli Street | 2136 | 349,900 | 3 | 3 | 1 | 2 | 2013 | |
| 59043343 | 4408 B Eli Street | 2136 | 359,900 | 3 | 3 | 1 | 2 | 2013 | |
| 47822127 | 4408 C Eli Street | 2136 | 364,900 | 3 | 3 | 1 | 2 | 2013 | |
| 23863506 | 1615 Spring | 2224 | 425,000 | 3 | 3 | 1 | 2 | 2013 | |
| 10674748 | 1619 Spring | 2224 | 439,000 | 3 | 3 | 1 | 2 | 2013 | |
| 37972261 | 4412 Eli Street | 2353 | 424,900 | 3 | 3 | 1 | 2 | 2013 | |
| 48897979 | 4414 Eli Street | 2353 | 459,900 | 3 | 3 | 1 | 2 | 2013 | |
| 70839441 | 2028 Sabine | 2070 | 379,000 | 3 | 3 | 0 | 2 | 1519 | 2013 |
| 9989381 | 248 WESTCOTT | 2339 | 320,000 | 3 | 2 | 1 | 2 | 1575 | 1999 |
| 25489914 | 1606 Parker | 2049 | 369,900 | 3 | 3 | 1 | 2 | 2013 | |
| 46428300 | 4318 A O’Reilly | 3100 | 629,900 | 4 | 3 | 1 | 2 | 2500 | 2013 |
| 71192648 | 6113 TYNE ST | 1744 | 300,000 | 4 | 1 | 0 | 1 | 5600 | 1927 |
| 61844104 | 1729 EDWARDS ST | 2374 | 390,000 | 3 | 3 | 0 | 2 | 1487 | 2007 |
| 67840477 | 5415 CROOMS ST | 2469 | 449,900 | 3 | 2 | 1 | 0 | 5000 | 2005 |
| 16651846 | 818 REINICKE ST | 2421 | 420,000 | 3 | 3 | 1 | 2 | 1310 | 1999 |
| 88324494 | 5342 DARLING ST | 2040 | 300,000 | 3 | 3 | 1 | 2 | 1666 | 2003 |
| 12026542 | 321 Sandman | 2368 | 429,000 | 3 | 3 | 1 | 2 | 2069 | 2000 |
| 42040482 | 1415 Colorado | 2750 | 394,000 | 3 | 3 | 1 | 2 | 2013 | |
| 45465561 | 1810 STATE ST | 1060 | 225,000 | 3 | 1 | 0 | 1 | 5000 | 1910 |
| 61201449 | 958 Patterson St | 2499 | 389,000 | 3 | 3 | 0 | 2 | 1557 | 2006 |
| 73048434 | 4916 MAXIE | 2578 | 359,900 | 3 | 2 | 1 | 2 | 2500 | 1999 |
| 38884516 | 1315 BIRDSALL ST | 2218 | 359,000 | 3 | 3 | 1 | 2 | 2388 | 2006 |
| 25153747 | 2728 SHERWIN ST | 1519 | 279,900 | 3 | 2 | 0 | 2 | 1621 | 2006 |
| 26688646 | 5925 Katy | 2030 | 359,000 | 3 | 2 | 1 | 2 | 2500 | 2013 |
| 52180218 | 6005 Hamman | 3459 | 454,900 | 3 | 3 | 1 | 2 | 2642 | 2008 |
| 7140429 | 519 Gate Stone | 2970 | 549,000 | 3 | 3 | 1 | 2 | 2124 | 2004 |
| 98650800 | 4109 Eigel | 2154 | 404,900 | 3 | 3 | 1 | 2 | 2013 | |
| 41205928 | 1611 DETERING ST | 2250 | 315,000 | 4 | 2 | 1 | 2 | 1975 | 2005 |
| 94767893 | 5612 LARKIN ST | 962 | 199,900 | 2 | 1 | 0 | 1 | 5350 | 1955 |
| 69202774 | 5443 KANSAS ST | 2336 | 339,000 | 3 | 3 | 1 | 2 | 1894 | 2006 |
| 88784759 | 5806 B Kansas | 1846 | 284,900 | 3 | 2 | 1 | 2 | 2008 | |
| 92736144 | 2110 SHEARN ST | 1332 | 270,000 | 2 | 2 | 1 | 2 | 0 | 2008 |
| 37309608 | 5522 DARLING ST | 2582 | 349,900 | 3 | 3 | 1 | 2 | 2281 | 2007 |
| 71854084 | 4710 DICKSON ST | 2394 | 389,000 | 3 | 2 | 1 | 2 | 1950 | 2000 |
| 19716174 | 2209 SANDMAN ST | 2440 | 339,900 | 3 | 3 | 1 | 2 | 1692 | 2008 |
| 70577943 | 5407 KANSAS ST | 1986 | 309,900 | 3 | 3 | 1 | 2 | 1485 | 2004 |
| 77900106 | 4207 A Koehler | 2233 | 309,900 | 3 | 2 | 1 | 2 | 2013 | |
| 75118408 | 3842 CENTER PLAZA DR | 1138 | 265,000 | 2 | 2 | 0 | 2 | 1744 | 2005 |
| 42274176 | 511 BIRDSALL ST | 2352 | 515,000 | 3 | 3 | 1 | 2 | 2500 | 2007 |
| 42656590 | 4111 Eigel | 2154 | 369,900 | 3 | 3 | 1 | 2 | 2013 | |
| 60195934 | 6526 PICKENS ST | 2887 | 769,000 | 3 | 3 | 1 | 2 | 2625 | 2011 |
| 72241343 | 4400 EIGEL ST | 1820 | 295,000 | 2 | 2 | 0 | 1 | 1710 | 2004 |
| 17885496 | 5537 DARLING ST | 2152 | 329,900 | 3 | 3 | 1 | 2 | 1411 | 2005 |
| 39663370 | 5222 WASHINGTON | 1626 | 325,000 | 3 | 2 | 0 | 2 | 1720 | 2004 |
| 41667440 | 5736 KANSAS ST | 2664 | 329,000 | 3 | 3 | 1 | 2 | 1975 | 2007 |
| 96194769 | 5417 Kiam Street | 2609 | 334,900 | 3 | 2 | 1 | 2 | 2687 | 2005 |
| 26834118 | 627 Fowler St | 2476 | 589,900 | 3 | 3 | 0 | 2 | 2013 | |
| 80051102 | 4640 Cornish | 2085 | 354,900 | 3 | 2 | 1 | 2 | 2013 |
Active Listings
There are currently 192 homes active on the market. That’s down 13% from January of 2013, There were 49 new listings that came available in January. Of those, all of those new listings are still available for sale.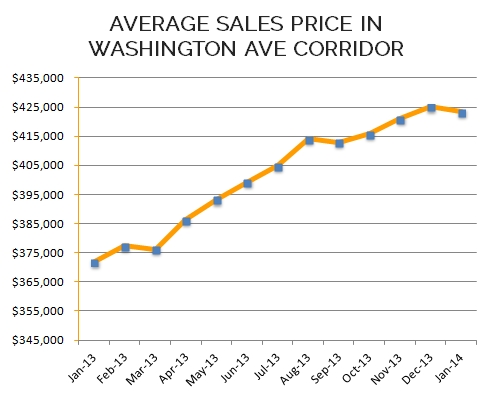
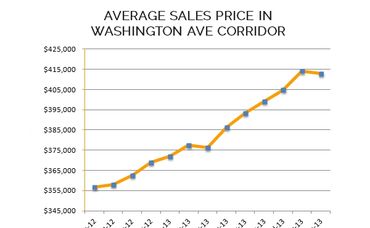
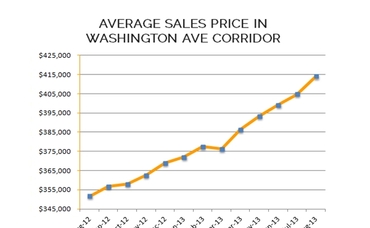
Home Prices
For the 12 month period ending in January 2014, prices rose to $423,307 for Washington Corridor. That’s up 14% from the same period ending in January 2013, which was $371,963.
The Washington Corridor is the place to live and play in the city of Houston. Some of the trendiest bars, bistros, and gastro-pubs make the Washington Corridor and Rice Military area their home. The residents of this area love the close proximity to Memorial Park, Downtown, and the Galleria. This hip Houston neighborhood has seen a lot of residential and retail development over the past 10 years and this trend continues.